| Real-ish Time Data (in progress) | The Pahala DoH Station Tour | Pahala Historical Data (HDOH) | Halemaumau Historical Data (HVO) |
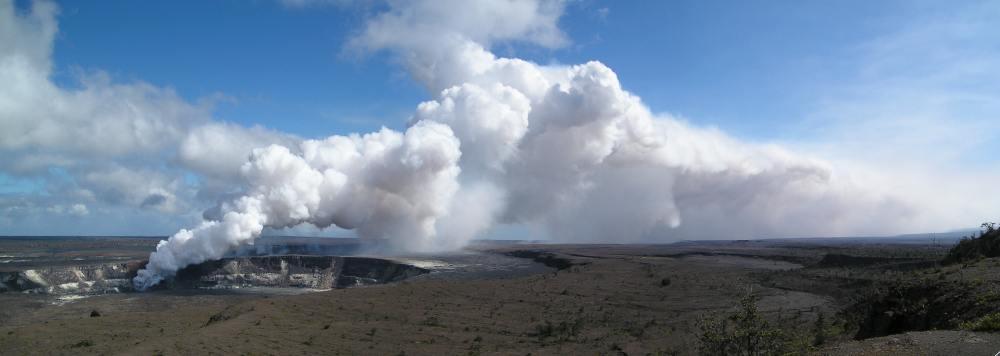
This is the Plume as it leaves Halemaumau - Pahala is to the right, under the plume. (Sept 2008) (image t. Brattstrom)
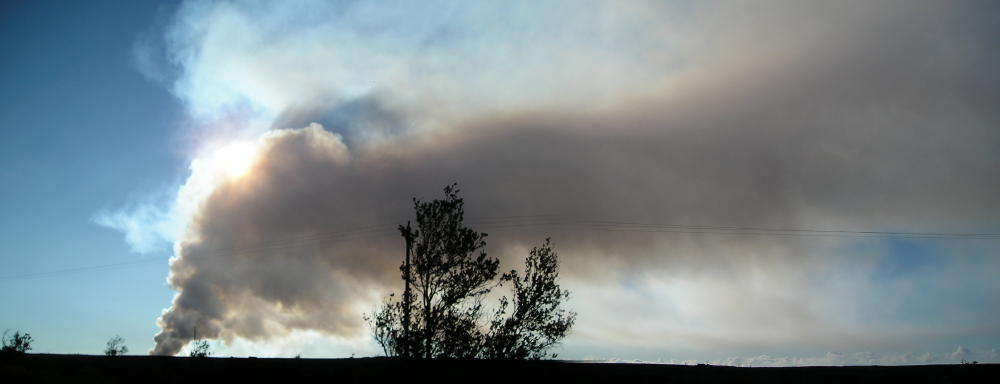
A view of the plume as it heads for Pahala - the sun is behind it. (a Sept 2008 morning) (image t. Brattstrom)
ORIGENS: Current Data (so far) Refresh to get "current" information
Vog Map from Kilauea (HVO) Sulfur Dioxide Plume from Kilauea Green=Good, Yellow=Moderate, Orange/Red = Unhealthy   |
The Origin of our Vog  This is the Current view from HVO of the plume starting in the Halemaumau Vent (typically on a 10-15 minute refresh) |
||||||
|
Particulates (PM 2.5) Click on it to get the 24 hour map page 
This chart is only
as updated as
the DoH makes the data available - generally it is within the hour...
sometimes not. It is also ONLY the Particulates - NOT the SO2
|
 The UV sensor is messed up currently - so this isn't useful at the moment....
Our Pahala "test" - Can we detect SO2 with our weather station? 
 We tried to Quantify this! It looks like it doesn't work (or not consistently)
It turns out that SO2
is absorbed in the UVB range, in fact, in the same region the UV sensor
on the Ka'u Science Weather Station operates on! Comparing the
relationship between
Solar Radiation and UV Index gives a hint on the SO2
over
Pahala (technically, between the sun and the sensor). If Solar
Radiation is high, and UV is low - there is most likely to be SO2! With
some analysis, we
should be able to come up with an approxiamate scale / correlation with
SO2 levels.
I will found some students to take this on as a project. see below
Occasionally the UV will be higher than the Solar radiation. This means
there is a medium regular cloud - and the UV makes it through, although
the visible light is somewhat blocked. |
||||||
| http://www.epa.gov/airnow/2009/20090321/pm25/pm25-24a-hi.gif This is an animation of the Particulate levels for any day... it's archived, so, by changing the date in the URL, you can look back. Sorry for the inelegance. Change the 20090321 in the url to reflect the date you want. If you want to look back to 2008, you have to change the parent-folder too! |
The above Hypothesis formed the basis
of a science fair project by Dakota W. and Anjulie L.
Alas, the hypothesis was not supported by the data. There were days of high Sulfur dioxide and no anomaly, and days of low sulfur dioxide with high anomaly. Drat! |
Here's the latest DoH site - it is usually a little late - Watch the times!!!
1 ppm = 1000 ppb
1part per million = 1000 parts per billion
See this site in it's own window
What do those colors mean in terms of Levels and Effect
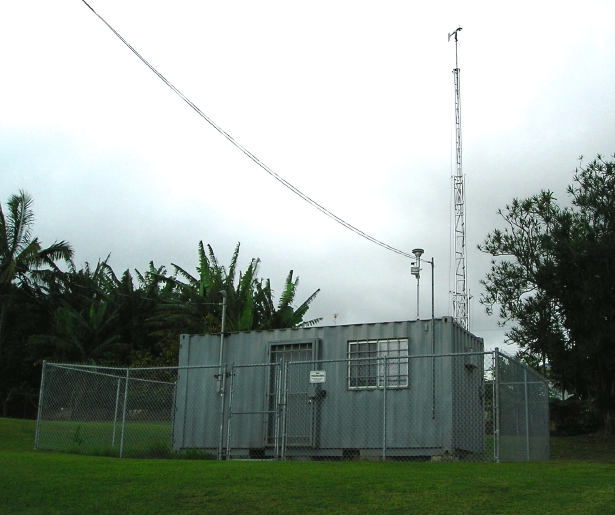
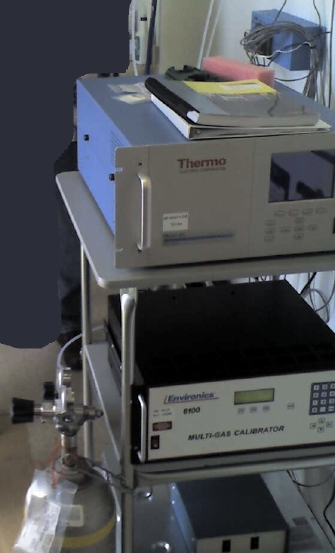
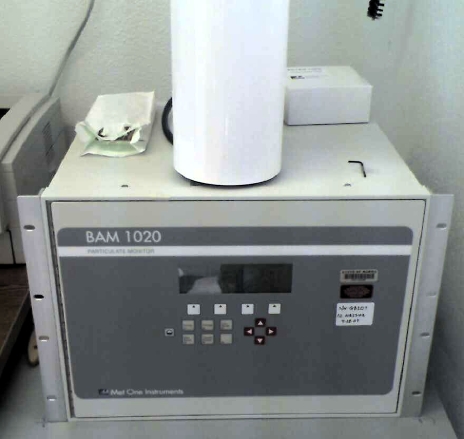
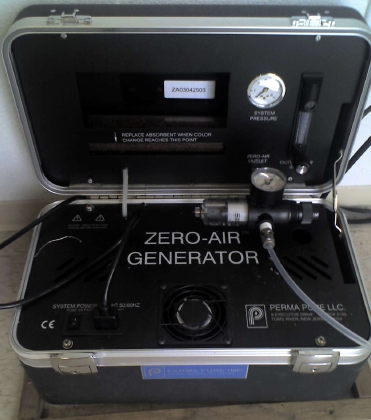
The Department of Health's SO2 & Particulate monitoring station in Pahala - 2008,
alongside Ka'u High School