

![]() MOAE - Ka'u High
MOAE - Ka'u High ![]()
Tradewinds (Hawaiian)
in construction
|
|
|
|
|
|
Tradewinds (Hawaiian) |
|
|
|
|
|
|
|
|
|
|
|
||
|
|
|
in construction |
|
|
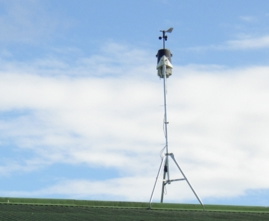
Origin: The MOAE project began when I set up a Davis wireless weather station on top of J building at Kea'au Middle School, and started receiving the information in my classroom. With the HP Technology for Teachers grant, we started taking it to the next level - using the data, as well as building a website to archive the data and use in a daily weather observation. With HNLC and two new grants, NOAA's Hawaii from Space, and Nike's - Jordan Fundamentals - we've been able to take it to the next levels - from space, and from below the ground.Having moved to Ka'u High School - I am carrying on with the program, and adding more...
Daily Weather Monitoring & Predicting
At the beginning of class we look at the current data from the weather station and log it.Date - Time - Temperature - Humidity - Pressure - Wind Speed - Wind Direction - Rainfall for the last 24 hours
In addition, we note the presence of Vog (Volcanic smog from the Pu'u O'o vent) and the presence of Snow on Mauna Kea.
Mauna Kea snow, as well as the weather satellite images, and radar images are checked from the weather web page. Depending on the current weather, we may try and predict tomorrows weather, predict when snow will fall on Mauna Kea, explain the humidity, or vog.
Plotting the Weather / Climate over the longer scale & Predicting
Periodically through the year, selected data will be graphed and further analysis is performed on the data. The most useful data to plot is Temperature, Humidity and Rainfall.Wind Speed and Direction is highly variable in student logged data, and detecting correlations is difficult. Use of the daily average may prove useful for those parameters.
Pressure has a daily cycle, so an average of the daily maximum and daily mimimum could be useful (or just the maximum or just the minimums)
First Trial
The first trial for the year pits the student logged data against their graphing skills - Alas, many 8th graders have a poor understanding of data graphing. Typical mistakes include non-linear axis increments, not leaving space for days with no data logged, and always drawing the line to connect to 0,0
Predictions to be made include the temperature and rainfall for the next month
Second Trial
The second trial makes use of the archived data and Excel spreadsheet and chart abilities. The data for the weather station is available as a spreadsheet online. Students will download the data, and manipulate and analyze the data in Excel. A chart of their chosen data will be printed, as well as the information described and analyzed.
Predictions to be made include the temperature and rainfall for the coming months and the next year
Awaiting updating: Here's one of them
Power Point Introduction Trial 1
Power Point Introduction Trial 2Instructions Trial 2 Part 1 Instructions Part 2 and Questions The PowerPoint and Instructions are Working Copies - they are changed as Details Change. "PowerPoint Introduction Trial 2" was modified from Trini Hironaga's original PPT for math classes during the second years implementation.
|
|
||
|
|
|
|
For weather satellite equipment - computer, software, receiver, antenna,training (Thanks Lucas!!) |
To stimulate the idea - and providing computer, projector, software, scanner/printer, camera, training |
To allow the continuation and expansion - and providing the seismometer, video, and other materials |
|
|
|
|
For the initial KMS Davis Weather Station and data collecting software |
|
|
|
|
||
For the Ka'u HS Davis Weather Station and data collecting software 2007-2008 |
||
|
|
|
|
|
|
||
|
|
|
|
No - these activities are not "standards based" - meaning that they do not derive from the standards.
(for those people that freak out about this comment - perfectly reasonable Standards Based Lessons / Units can be constructed using these activities - Which came first, the science or the standards?)
They do derive from science, and are appropriate to science education in the 20th century. Sure, the 20th century ended several years ago, but all of the techniques derive from 19th and 20th century science. Satellite monitoring and satellite weather monitoring in the classroom goes back to the Kettering Group in the late 1950's! Weather monitoring and Seismometry are "old tech" also. What does bring this all into the late 20th century is the ability to collect and display and distribute date via the internet. It will be interesting to see what the 21st century brings in the way of science education.However, these activities address the standards, and, of course, exceed the standards - because - the Standards are the Minimum according to the Hawaii State Superintendant (or at least, that was her statement several years ago) - alas, many administrators think that the standards are what is only to be attained. Not to mention that the test (HSA) only looks at the proficiency in the standards, and then, only in Math and English. (yes, there is a science one, but it "doesn't count")
Web Page initiated and irregularly "maintained" by ted Brattstrom - March 2006 -Sept. 2008-May 2011